
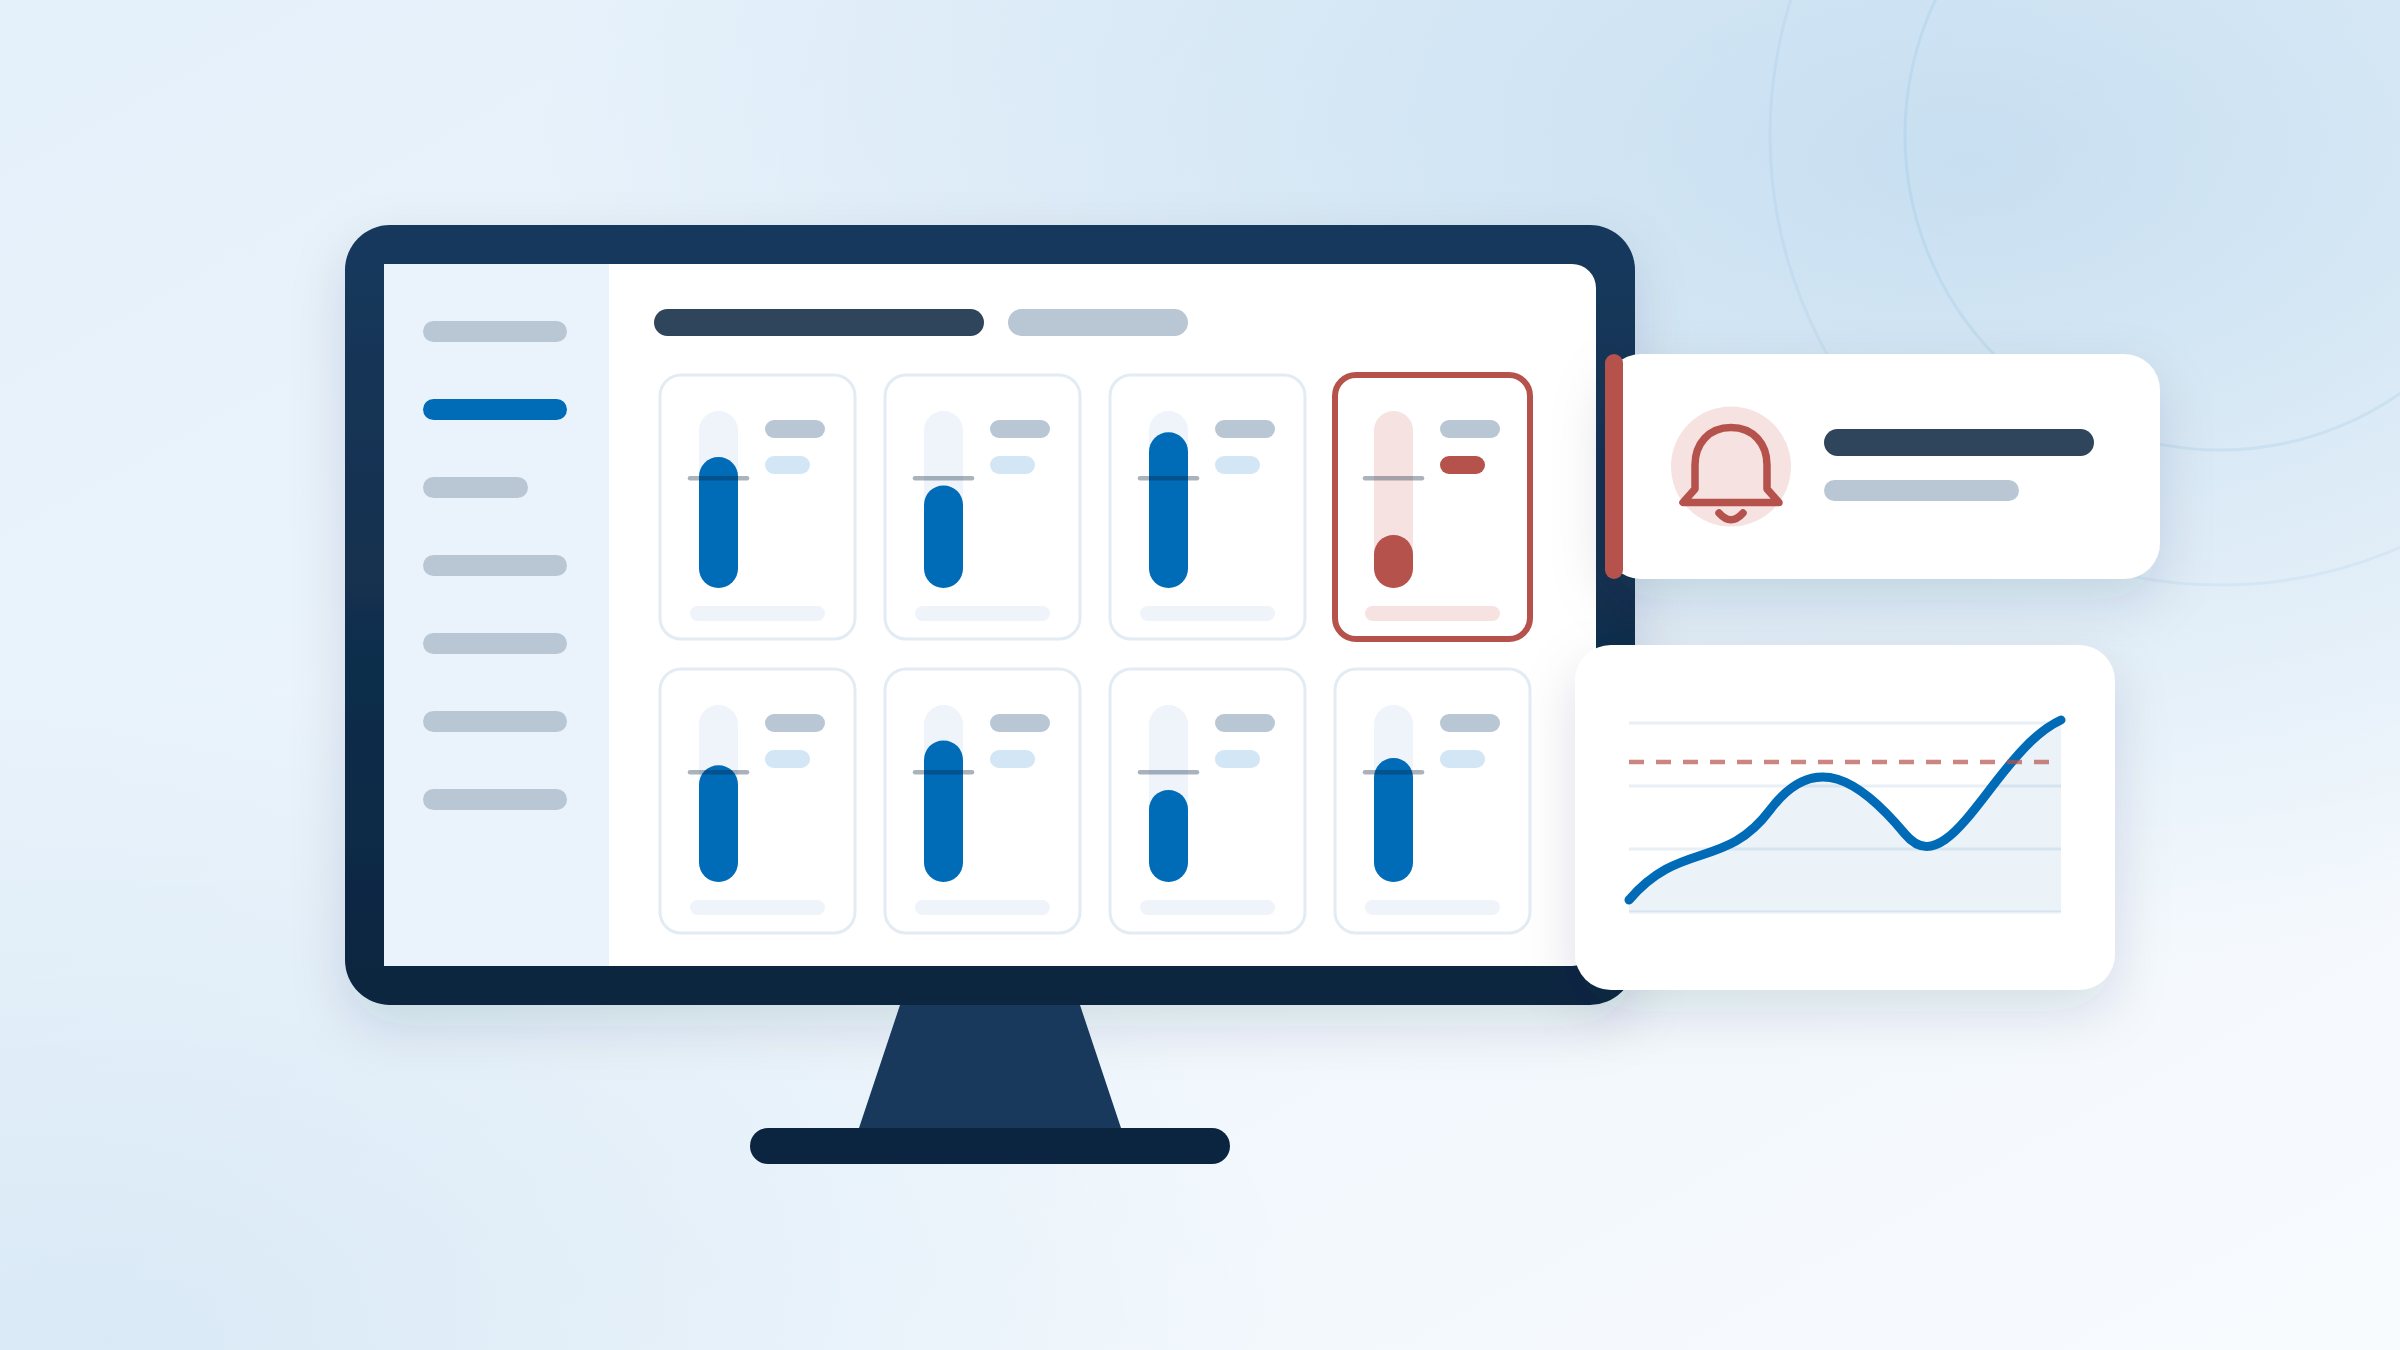
KVMControl is the operator's view of a Kytola flow monitoring system. Connect it to the KVMServer and monitor every measuring point live: flows, alarm limits and alarm states, all in one clear view
Run KVMControl on any number of PCs on the network — in the control room, the maintenance office or on a laptop on the mill floor. Every client has access to full process monitor data including trends, history and volume information
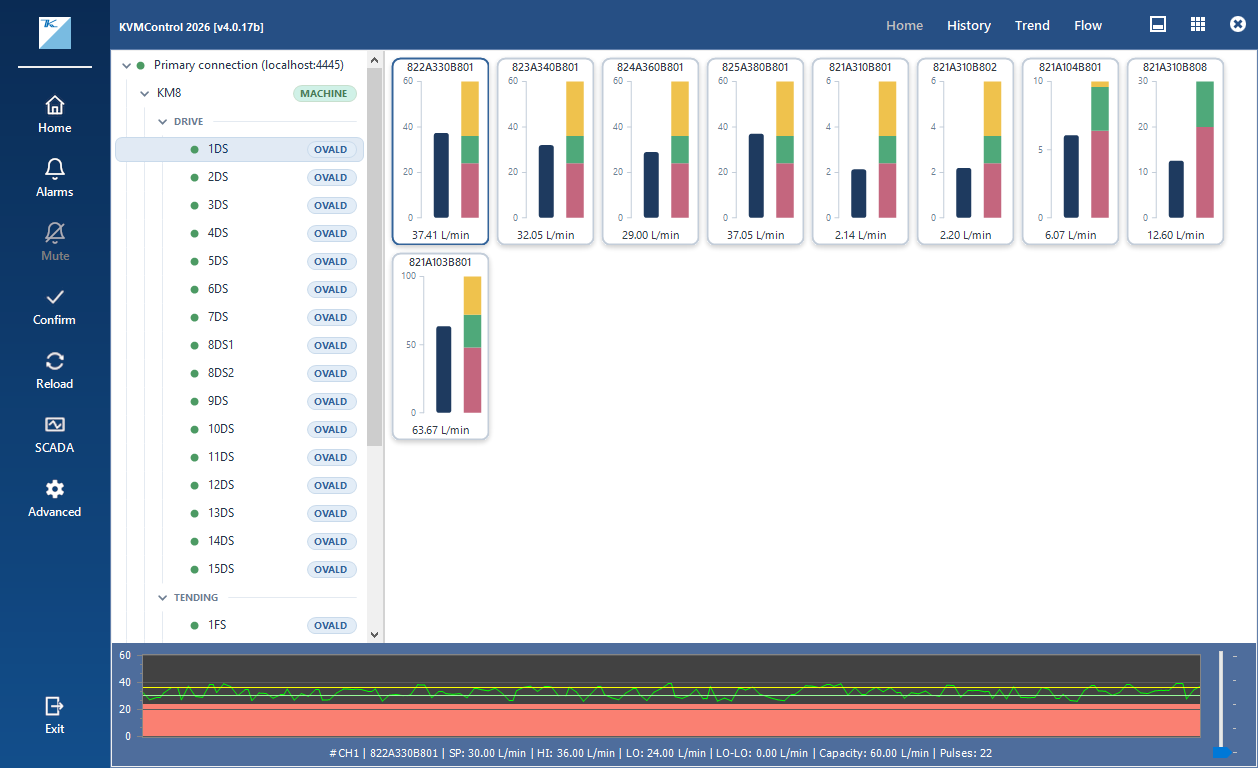
Live monitoring
- Every measuring point shown live, with its setpoint and alarm limits (LO-LO, LO, HI) drawn right on the gauge
- Customize display gauge for your need, and fit up to 96 of them on one screen
- Follow several sites or KVMServers from one KVMControl
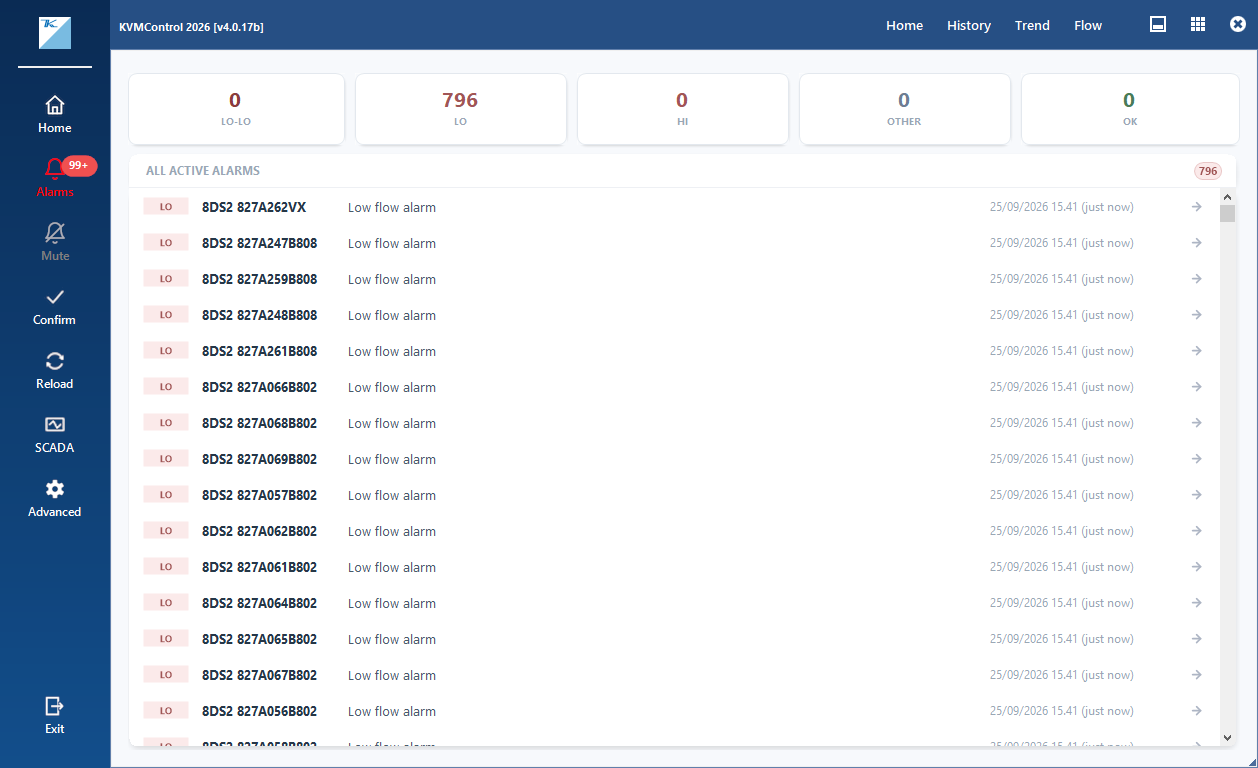
Alarms you cannot miss
- Alarms arrive the moment they happen, with an overview of active alarms by severity
- Audible alarms, configurable per alarm level, that keep sounding until the alarm is acknowledged
- Acknowledge alarms directly from the alarm list, and see at a glance which are still open
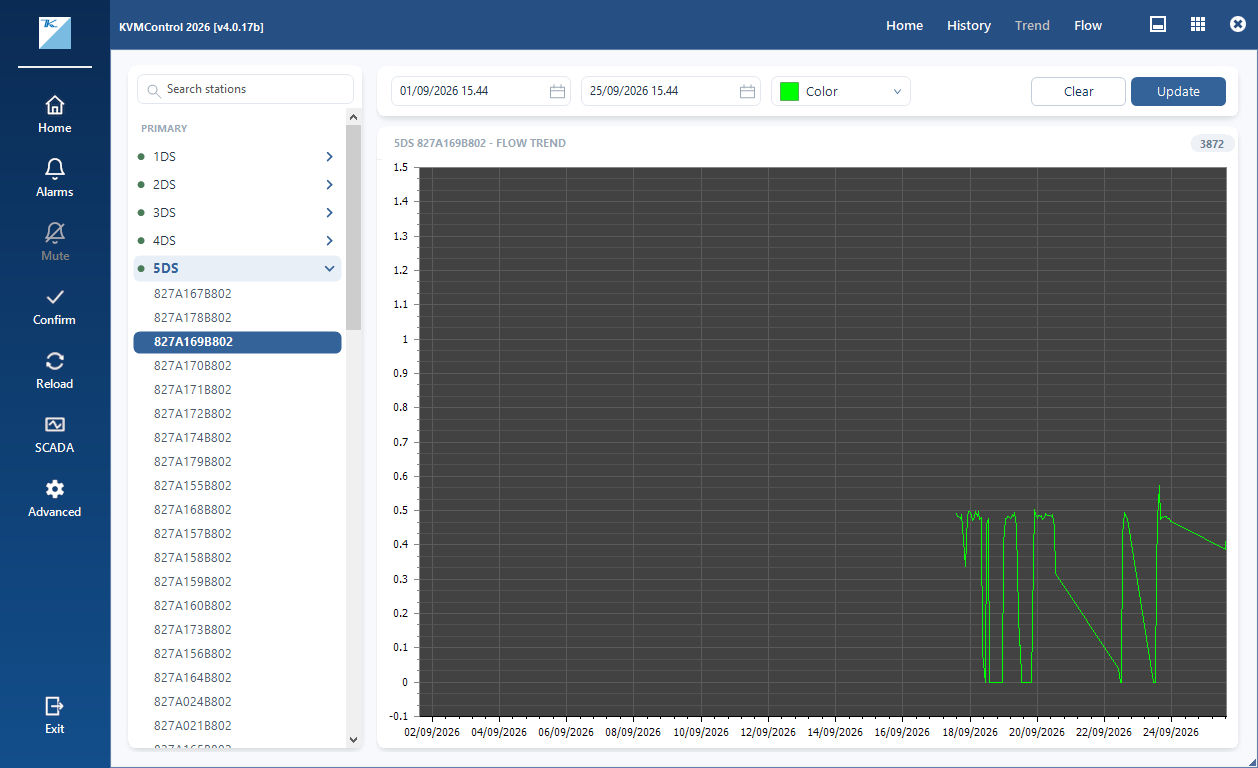
History, trends and totals
- Browse alarm and event history, and print it for reports
- Trend charts from the last minute up to 30 days or more
- Live flow totals: total and session volume with flow rates for every station, across all connected sites
Your own process views
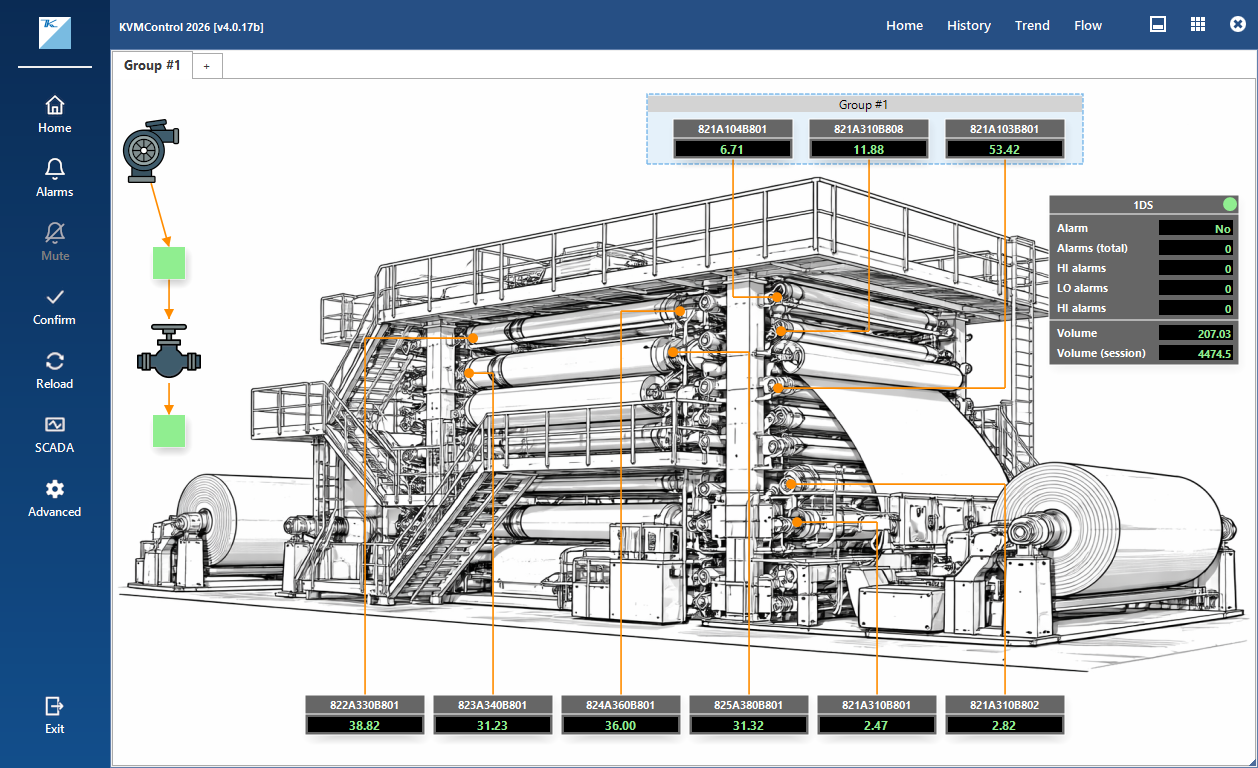
- Build SCADA views of your own machines and lines: create a new view for any machine straight from the tree and it opens in its own tab
- Place live measuring points, values and alarm indicators exactly where they are on the real machine, with the built-in designer
- Every view updates live and shows alarms in place, so operators see not just that something is wrong, but where
- Views are saved and open again ready to use; build as many as your site needs
Part of KVMSuite 2026
- Can be installed stand-alone on locations where no configuration or server managment is required
- Installs online or offline from a USB stick, and stays up to date with KVM update tool
- Online or offline update packages available